Finished CHF/JPY Trade
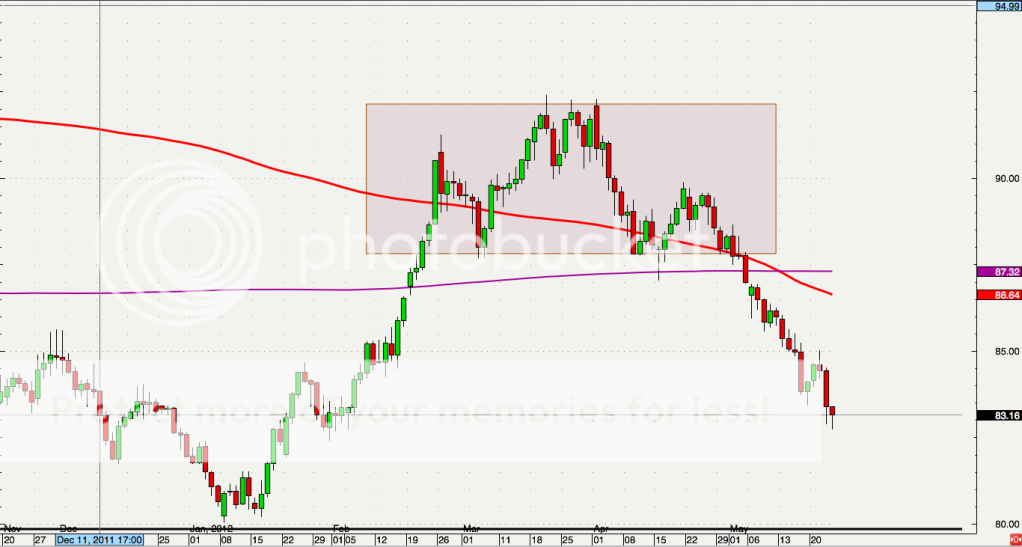
The CHF/JPY broke the 800sma daily SurpriseBox to the downside with a head and shoulders pattern. This was very significant as it formed a gap on May 6 out of the box, May 8 there was a bearish candle out of the gap and on May 10 there was a crossover between the 800sma and the 200sma. Got out at 83.72 corresponding to a long bearish candle after the break. Also near the 2x from the top of the head to the neck.
Disclaimer: I trade the patterns depicted either at the entry point stated (e.g. trading channel, breakouts) or afterward. Although my trades are based on technical analysis, trading forex is a risky activity and may produce significant monetary loss. I only make public the trades that I am considering to make, or made and the rational for them. Not intended necessarily as trading recommendations. By SurpriseTrade@gmail.com